Respiratory Rate 
Vital signs are used to measure body’s basic functions. These measurements can give some important information of the physical health of a person or can discover diseases that can be predicted before they happen. This last point is very important, because if a disease is discovered in his initial forms, then it can be faced immediately reducing the possibility to reach his evolution to more difficult forms. One important Vital Sign is the Respiratory Rate (RR): the number of breaths a person takes in one minute. An abnormal Respiratory Rate can predict cardiac arrest and it’s highly correlated with in-hospital mortality . Moreover, several studies showed that assess the respiratory rate in high-risk COVID-19 patients could accelerate life-saving treatments . Consequently, monitoring RR is necessary to assess patient’s health both in hospital and at home. Nowadays the clinical practice for the RR estimation is done by counting chest wall expansions, but it’s very inconvient to assess if a person has an abnornal RR and mostly it’s not continuos. This necessitates the use of unobtrusive sensors for obtaining respiratory information from patients in normal situations. For this reason I have implemented a Deep Learning model able to predict the Respiratory Rate, gathering artificial data and real data from a pulse oximiter
Signals
The pulse oximiter I used such as many wearable devices allow for an ambulatory monitoring of the photoplethysmogram (PPG) signal. The PPG is modulated predominantly by respiratory system and so it can be used to predict Respiratory Rate. In order to retrieve the PPG signal from the device, the Department of Information Engineering of Padua developed an android application, capable of saving in csv files the recordings of the pulse oximiter.
In this work I used Synthetic Signals, Real Signals and Data Recorded by the pulse oximiter. The first are generated by a MATLAB script, with different configuration parameter as the sample rate, the respiratory rate target and some amplitude modulation, while the second comes from BIDMC, a popular dataset extracted from the MIMIC-II resource. The Data Recorded are obtained by the pulse oximiter, and the measurements are done on one single subject.
Processing Pipeline
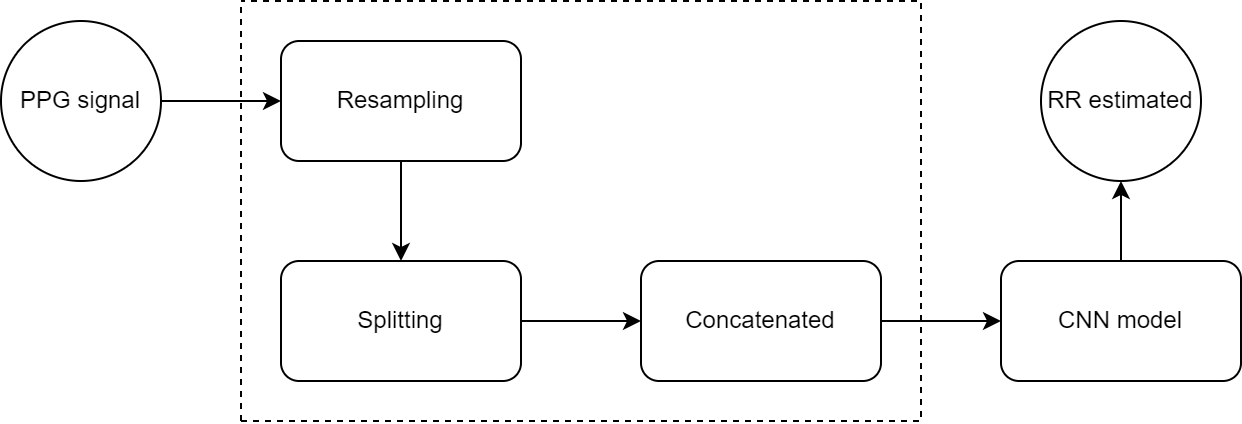
The figure below explains the processing pipeline of the entire project:
- Resampling: Synthetic and Real signals are resampled with the same frequency of the pulse oximiter
- Splitting: Signals splitted in single singnals of 60 seconds long.
- Concatenated: Signals are merged together and given as raw data to the CNN model

Model
In this project a CNN architecture is used to determine the RR given in input the PPG signal. In particular the CNN uses the residual blocks, a common variant of the CNN: ResNet. This one inserts skip connections in order to jump over some layers and avoiding the problem of vanishing of gradient. In particular The model is built with five residual blocks, followed by an Average Pooling layer that reduces the dimensionality. Then a Flatten layer is used in order to have a vector-like representation and finally two fully connected layer plus the output layer conclude the network.

Results
A crucial step in Deep Learning models is the tuning of hyperparameter. In this work this is done via a manual search and the model is fine tuned on the recorded data, in order to maximize the precision of the estimation given by the pulse oximiter.
The best result obtained, comparing the different configuration of the parameters, is an Mean Absolute Error of 2.84 .
All this aspects are deeply discussed in the report of this project